Top SaaS Management Metrics IT Leaders Should Track

SaaS subscriptions used to feel like easy wins: swipe a card, add a seat, keep working. A few years later most IT teams are wrangling hundreds of tools, each funded from a different budget and wrapped in its own licensing terms and data flows. The fallout is familiar: extra spend, duplicate apps, and blind spots that unsettle both CISOs and CFOs.
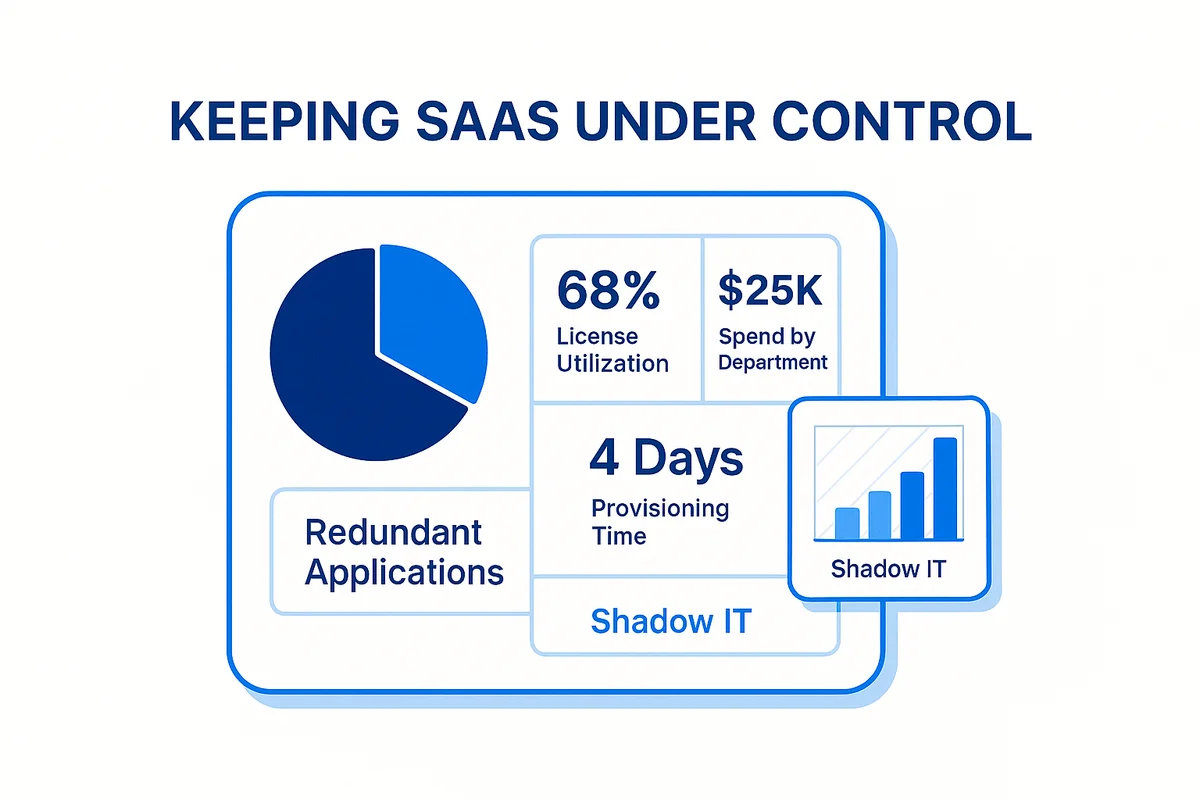
Reining this in doesn’t call for a giant audit or yet another platform. Start by tracking the right numbers: how many licenses people use, where the money lands inside each department, which apps overlap, what lurks in shadow IT, how long provisioning takes, and whether leaders can view everything on one dashboard. Shift these six metrics, and costs fall while risk fades.
This playbook walks through each metric and shows how to act on the data so you trim waste and lock down security fast.
Table of Contents
- Making Every SaaS License Count
- Shining a Light on Department Spend
- Spotting Overlapping Apps for Smart Consolidation
- Uncovering Shadow IT Before It Spreads
- Speeding Up Provisioning to Boost Productivity
- Bringing the Metrics Together on Dashboards
- Conclusion
- Audit your company's SaaS usage today
Making Every SaaS License Count
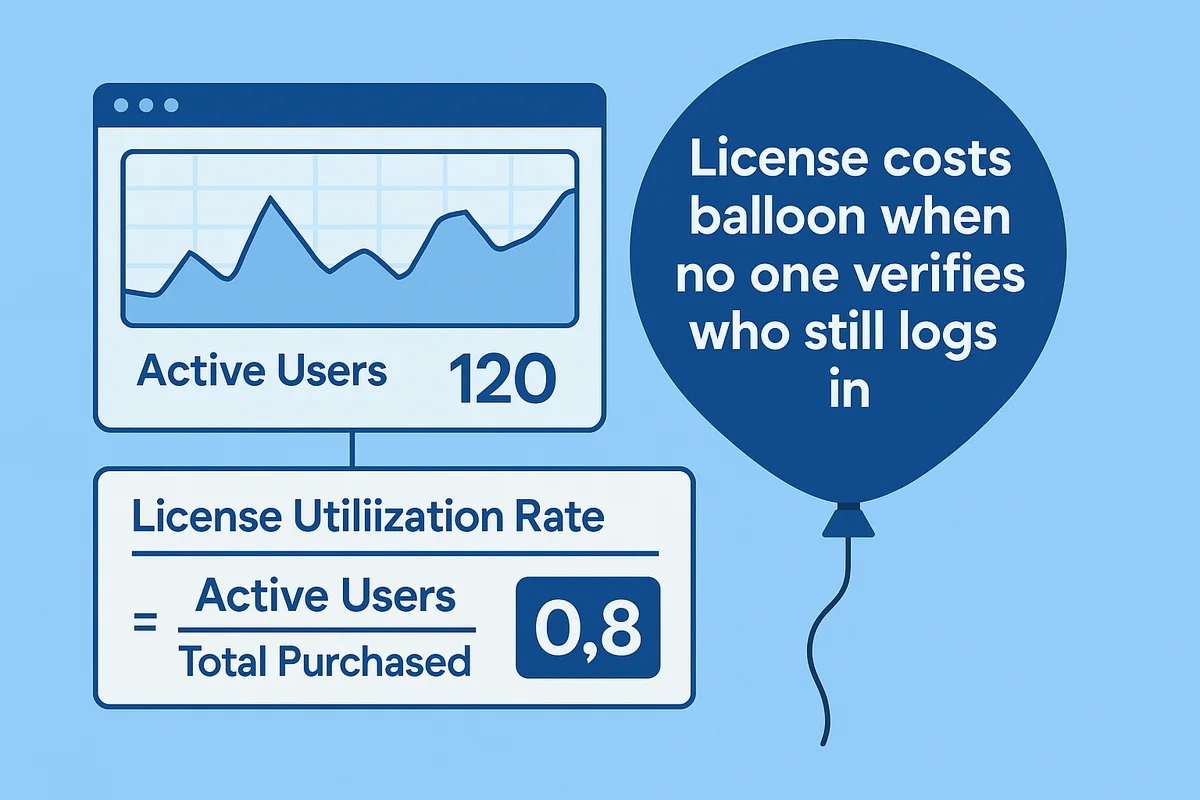
License costs balloon when no one verifies who still logs in.
Start by pulling raw usage. Most SaaS tools publish a daily active-user report through their admin API; if they don’t, single sign-on logs from Okta or Microsoft Entra usually fill the gap. Export the last 30 days, drop the file into a sheet, and keep only unique user IDs so churned accounts don’t skew the tally. That’s your “active user” numerator.
The denominator comes from procurement. Roll up purchase orders, renewal quotes, and any mid-year add-ons. With both totals in one sheet, the License Utilization Rate boils down to a single cell:
=ActiveUsers / TotalPurchased
Anything below 0.8 means you’re paying for empty chairs. Gartner puts the average waste around 25 percent for collaboration suites, so set a tighter goal and watch the number each month. Utilization often falls right after onboarding waves or layoffs; the report shows where to trim before the next renewal notice lands.
Small steps deliver big savings.
- Freeze seat increases until usage climbs past the target.
- Sweep inactive accounts every quarter and hand them to hiring managers instead of buying more.
- Negotiate flex allotments; many vendors, including Slack, now offer “true-forward” pricing that bills only for seats used.
Benchmarks vary. A content team may sit at 95 percent on Adobe Creative Cloud because licenses rotate daily. Keep separate targets by category so the alerts make sense.
Finally, plot the rate in a simple bar chart next to the renewal date. When executives spot $180,000 tied up in dormant M365 seats with three weeks to go, the green light to cut back arrives quickly. Simple math, real money.
Shining a Light on Department Spend
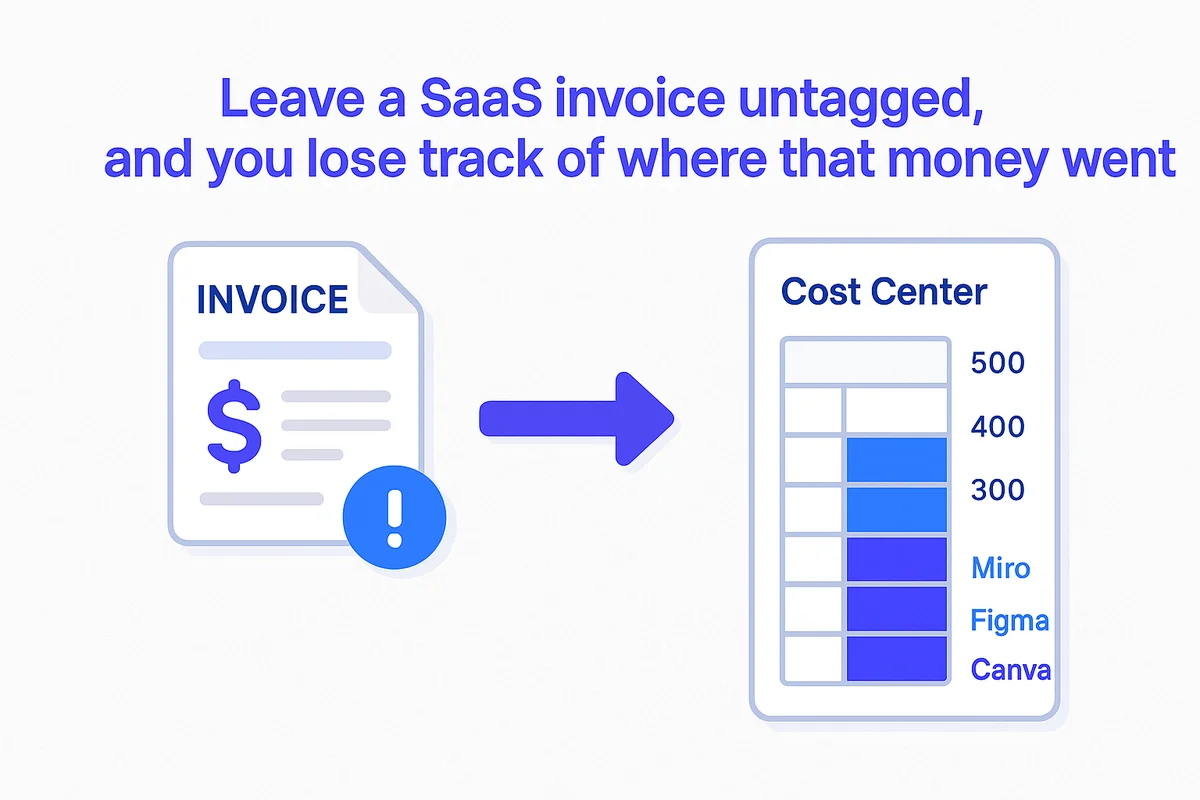
Leave a SaaS invoice untagged, and you lose track of where that money went.
Pull all recurring charges, whether they hit the AP queue or a manager’s corporate card, into a single worksheet first. Then add a “cost-center” column that matches your ERP structure so finance can pivot spend by marketing, sales, product, and every other group in seconds.
Getting the tags right sounds tedious, yet the mechanics are straightforward.
- Export last quarter’s SaaS invoices and card statements to CSV.
- Look up the requester or original purchase ticket to capture department, GL code, and business owner.
- Load everything into the ERP or a spend-management tool with those three fields required.
- Schedule a weekly job that auto-matches new receipts, flagging any entry missing a cost-center tag.
Once the data pipes flow, show the numbers back to the teams in the language they understand. A stacked bar chart that compares marketing’s Miro, Figma, and Canva costs next to campaign ROI will spark better questions than a spreadsheet ever could. Finance teams often add a show-back email each month so managers see what they spent and how it trends.
Line up spend with usage logs to spotlight pricey ghosts. If design holds 200 Figma seats at $540 per user annually but only 110 creators log in weekly, that’s a $48,600 gap ready to close before renewal. When adoption is strong, use that data to push for larger volume tiers at lower per-user rates. Either way, numbers beat anecdotes in budget talks.
Finally, build accountability loops. Require each business owner to sign off on their SaaS roster every quarter, confirming they still need every tool and seat they’re funding. The simple act of review keeps costs visible, trims duplicate requests, and turns “IT spend” into “our spend,” which is where the conversation should live.
Spotting Overlapping Apps for Smart Consolidation
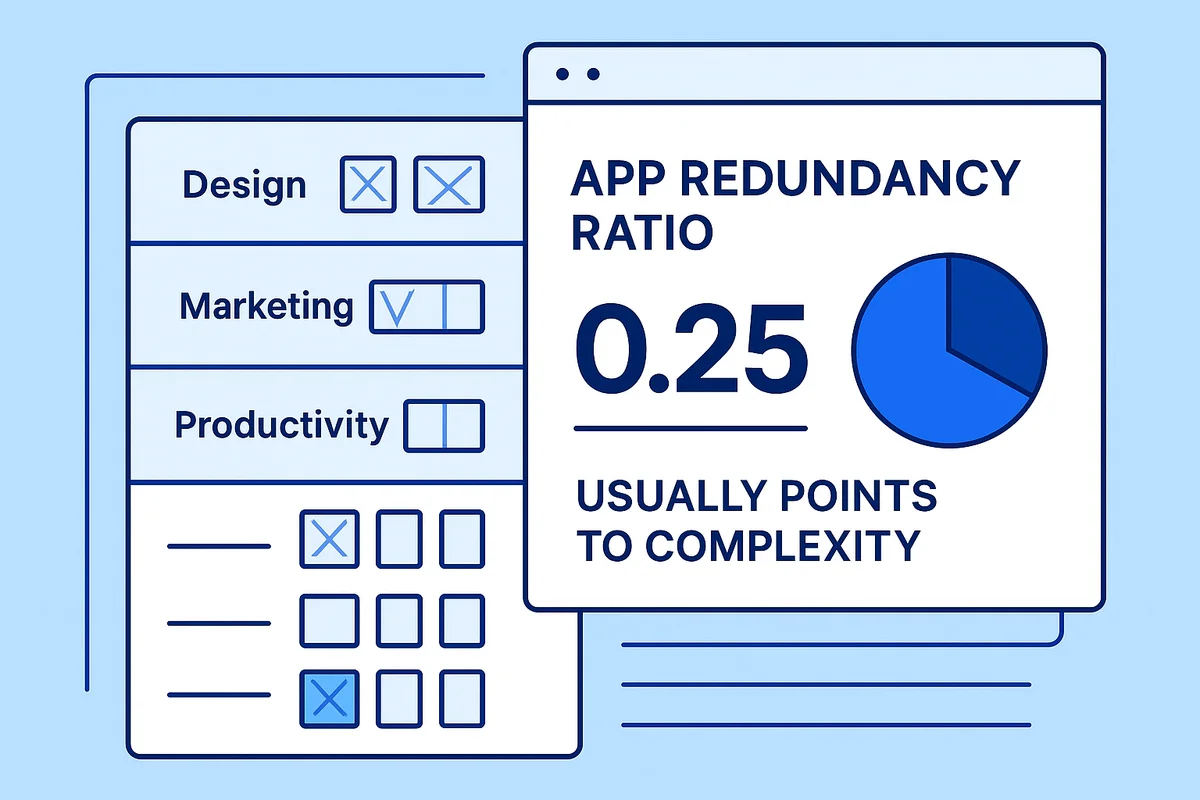
Duplicate SaaS tools slip in and quickly inflate the procurement list before anyone catches on. The App Redundancy Ratio spots this sprawl by comparing overlapping apps to the total number in each category. Anything above 0.25 usually points to complexity that drains budgets, onboarding time, and support tickets.
Start with a clear, lightweight taxonomy so anyone can tag an app without second-guessing.
- List core feature categories such as e-signature, video meetings, project boards, note taking, and digital whiteboards.
- Pull your purchase ledger and single sign-on roster, then assign each tool to the main feature it provides.
- Store tags in a spreadsheet or a system that refreshes as new apps appear.
- Mark any tool that claims more than one major capability as “multi-category” so it can be counted separately later.
With tagging done, divide the number of apps that share a category by the total number of apps in that category. If design shows twelve tools and five cover identical use cases, for example three UX mock-up platforms and two visual feedback apps, the redundancy ratio is 0.42. Productiv’s 2023 SaaS Trends report puts the enterprise average at 0.37, so anything higher deserves a closer look.
Consolidation offers more than license savings. Merging eight chat apps into one cuts context switching, improves message search, and tightens security because data now lives in a single audited platform. Let user satisfaction scores guide the choice; a well-liked point solution can stay if its NPS clearly beats the suite alternative. When you do migrate, roll early-renewal credits or feature bundles into the negotiation to sweeten the deal.
Track the ratio quarterly and post the trend on an executive dashboard. A steady decline shows progress, while a sudden jump flags teams that slipped around intake guards. Over time the metric becomes part of the culture, nudging every requester to ask, “Do we already have something that does this?”
Uncovering Shadow IT Before It Spreads
When official channels move slowly, employees look for workarounds. Shadow IT often starts as a browser add-on, a personal credit-card subscription, or a file-sharing link that spreads across the team before IT notices. Each unknown app broadens the attack surface, drags sensitive data outside governed systems, and chips away at the company’s audit trail.
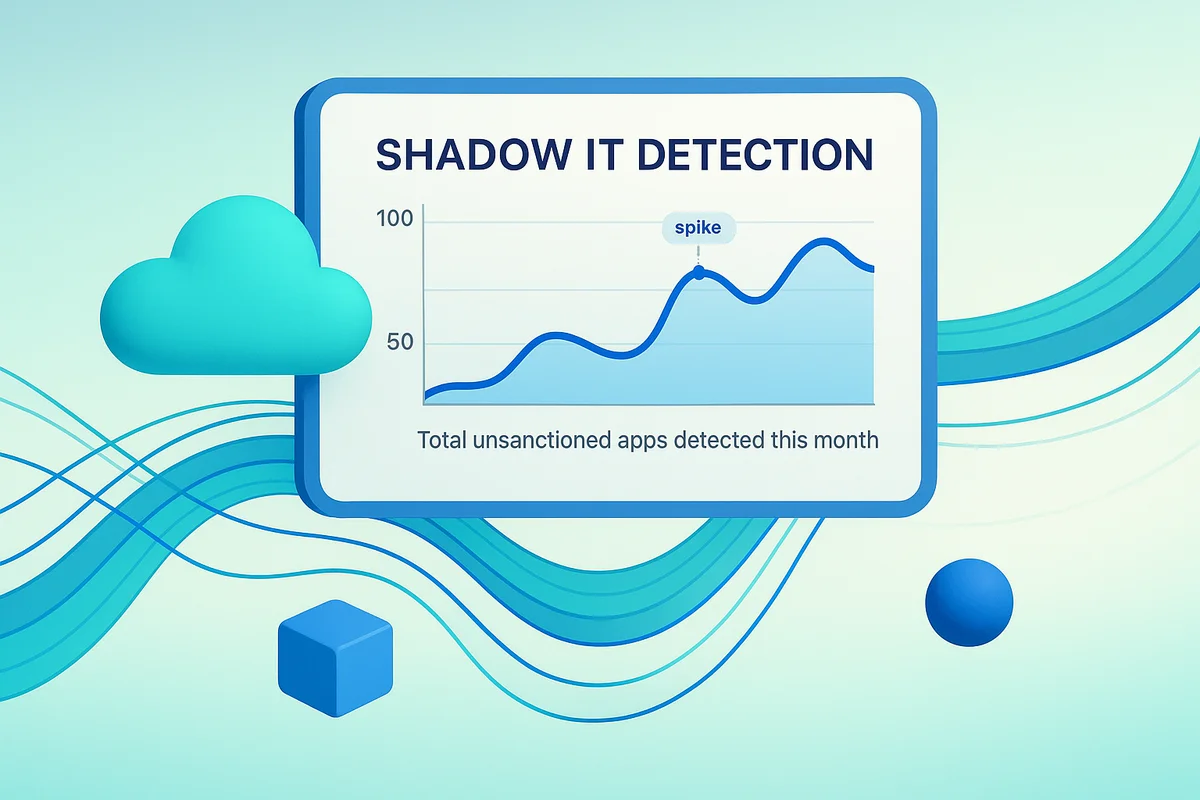
Start by fusing the signals already streaming through existing tools. A cloud access security broker like Netskope tags every outbound request, firewall egress logs catch odd destination domains, and single sign-on reports reveal who skipped the approved catalog. Layering these feeds in a lightweight data lake allows security analysts to count fresh discoveries daily, then roll them into a monthly Shadow IT Detection number that everyone can grasp.
The metric itself is simple: total unsanctioned apps detected this month. Track the trend in a line chart and annotate spikes with root causes; product launches, layoffs, or regional hires often explain the jump. When the count rises faster than headcount, the CISO knows it is time to tighten policy or speed up app review. Keep an eye on seasonality too; many firms see a holiday surge when contracting staff bring their own toolkits.
A rapid-response playbook turns the number into action.
- Assign each new app a risk score based on data residency, OAuth scopes, and user population.
- Notify the app owner within one business day and request a business justification.
- Block high-risk tools at the proxy until a formal assessment clears them.
- Migrate low-risk favorites into the sanctioned stack so users stay productive without breaking rules.
Tie resolution timelines to existing frameworks. ISO 27001 calls for documented corrective actions within 30 days, while SOC 2 auditors expect evidence of continuous monitoring.
Speeding Up Provisioning to Boost Productivity
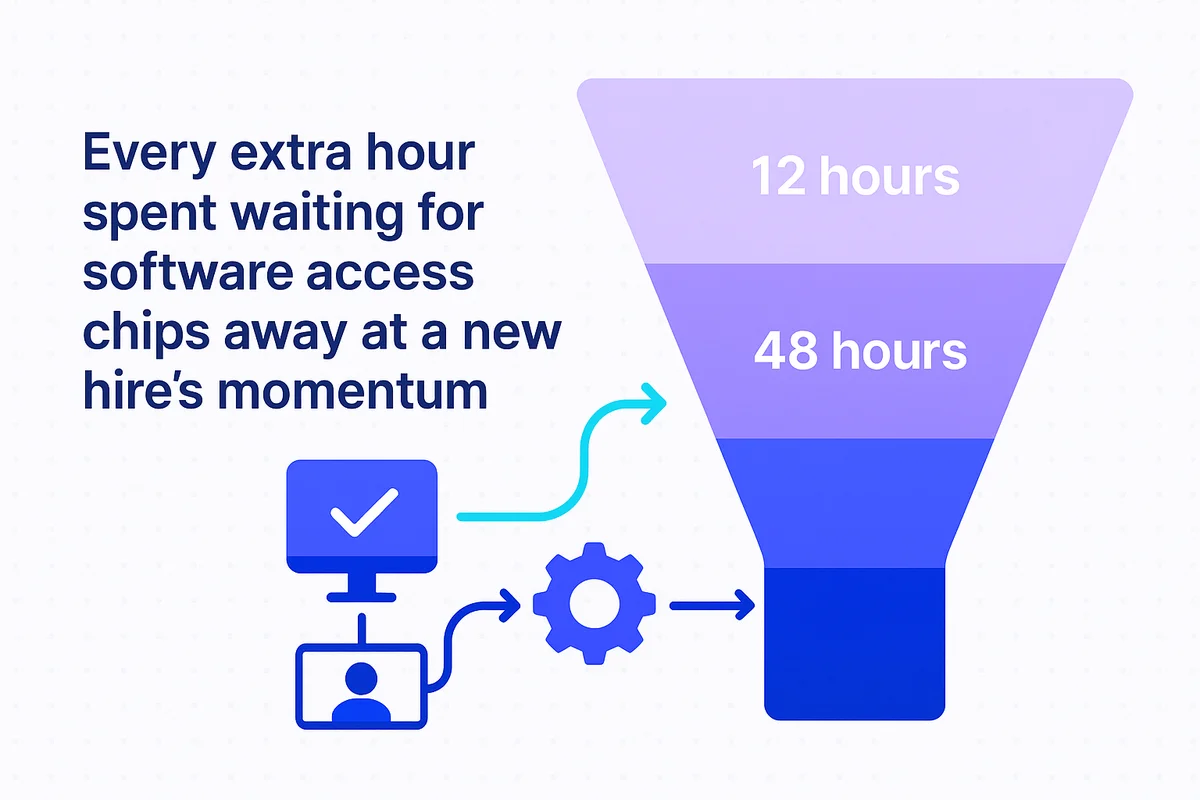
Every extra hour spent waiting for software access chips away at a new hire’s momentum.
Tracking Time to App Provisioning starts when an ITSM ticket hits “approved” and ends when the user signs in successfully. Record timestamps at each handoff, security review, role mapping, license assignment, single sign-on group sync. Most teams already have data in ServiceNow or Jira Service Management; export those logs to a small warehouse table and calculate median and 90th-percentile wait times each week. Gartner’s 2023 Digital Workplace survey puts a healthy median at 12 hours, yet many enterprises still hover near 48. The long tail matters more than the average because that’s where shadow IT grows.
Seeing the spread often surprises stakeholders: one app can clear in three hours while a similar tool drags on for three days because of a manual security checklist. Color-coding stages in a funnel chart makes the slowdown pop. For companies under ISO 27001, demonstrating the ability to provision and deprovision within a defined window also satisfies a key audit requirement.
- Auto-approve low-risk SaaS with predefined scopes
- Bundle access by role so IT grants five tools in one shot
- Sync HRIS events to Okta and fire provisioning at “new employee” status
- Hold an SLA: 95 percent of requests closed in 24 hours, review misses weekly
Deprovisioning deserves equal focus. A 2022 Ponemon study found 42 percent of ex-employees still reached at least one corporate app after departure. Stamp deprovisioning time from termination date to account disablement and tie the metric to offboarding SLAs. Quick removal cuts license costs and slashes breach exposure.
Faster provisioning isn’t just a nice gesture. Finance stops paying for seats that sit idle, security gets fewer sleepless nights, and product owners see adoption numbers sooner. As provisioning time falls, the Shadow IT Detection Count from earlier sections usually drops too. Remove friction, shrink risk, and free up budget at the same time.
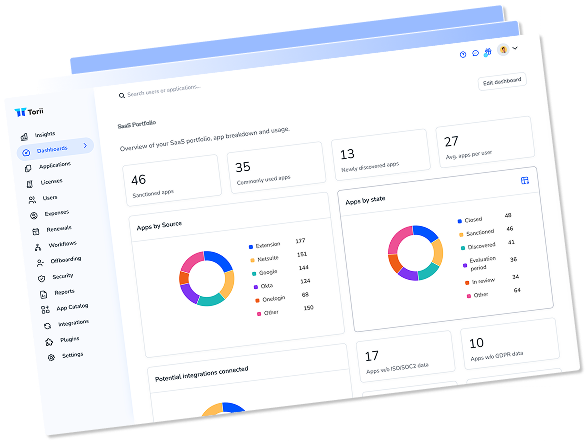
Bringing the Metrics Together on Dashboards
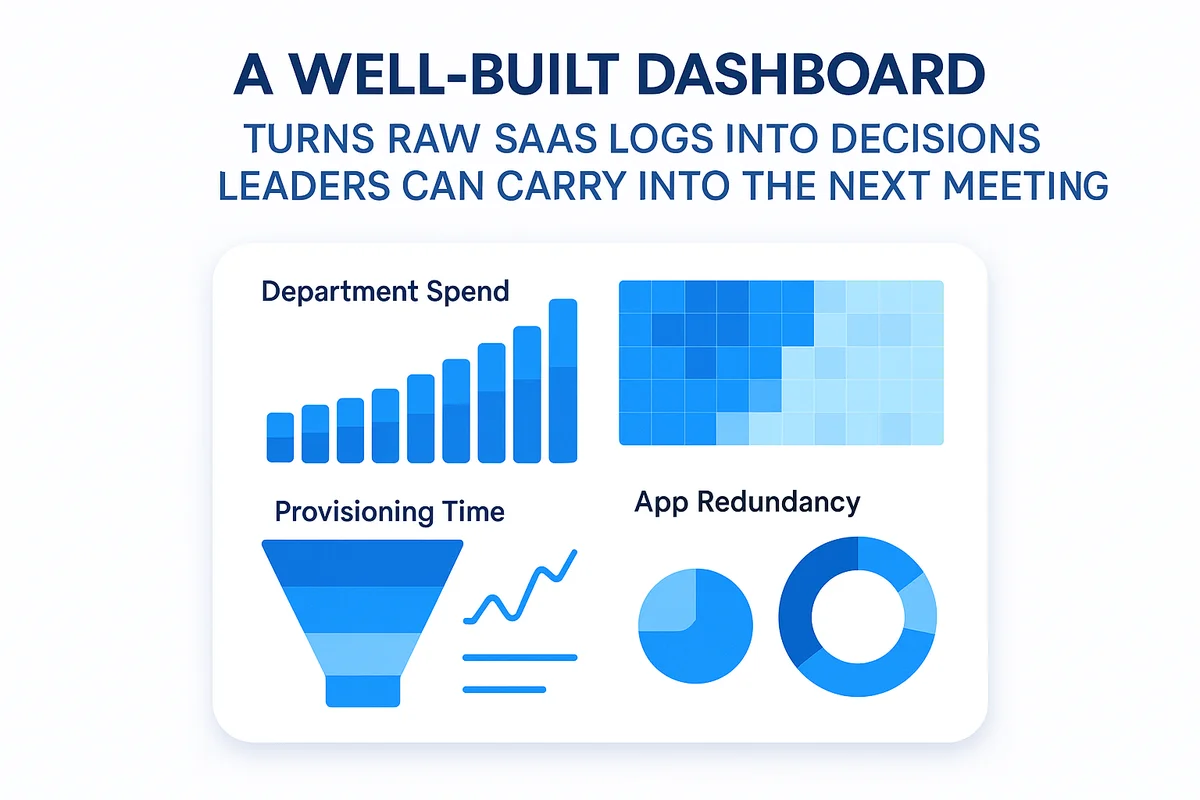
A well-built dashboard turns raw SaaS logs into decisions leaders can carry into the next meeting.
Strong dashboards start with clear audiences. Finance watches spend trendlines, security searches for policy gaps, and IT ops clocks workflow speed. Routing each group to its own tab in Power BI or Tableau keeps the conversation focused. When every chart pulls from a single data warehouse (typically Snowflake or BigQuery), teams debate actions instead of numbers. Tie each visual to one of six core metrics so no chart strays into “interesting but useless” territory, and stamp the data-add date in the corner to keep outdated snapshots out of slide decks.
- Stacked bars for month-over-month department spend
- Heat maps that flag apps above agreed risk scores
- Funnel charts showing median provisioning time at each handoff
- Sparklines for license use so leaders spot sudden drops
- Pie slices tracking app redundancy by category after each consolidation sprint
- Single KPI tiles for current shadow IT count against policy threshold
Near-real-time refresh pays off once alerts flow automatically. Set rule-based triggers in the BI tool or fire a webhook to Slack; for example, post a note when video-conferencing overlap creeps above 40 percent or when provisioning p90 tops three business days. Color-code the alert on the dashboard too: yellow means investigate, red means escalate. Showing both the spike and the next playbook step in the same tile removes guesswork, especially during board prep when time runs short.
Close the loop with a quarterly SaaS health review. Block two hours for IT, finance, security, and a rotating department lead. Spend the first half scanning each metric’s trajectory, then vote on one or two stretch targets (cut redundant project-management tools by 15 percent or shave a day off median provisioning, for instance). Finish by assigning owners and locking deadlines into the same dashboard, turning it from a read-only report into a living backlog everyone can see.
Conclusion
Keeping SaaS under control takes more than a hunch. With budgets tight, track license use to flag idle seats, break down spend by department to see who’s burning cash, check for redundant tools, identify shadow IT before it causes trouble, measure provisioning time so no one waits around, and roll everything into one dashboard. Each metric covers part of the picture; together they give IT, finance, and security the tools to cut costs, tighten oversight, and move faster.
Focus on those six metrics and you’ll trim SaaS waste and risk quickly without slowing everyday work.
Audit your company’s SaaS usage today
If you’re interested in learning more about SaaS Management, let us know. Torii’s SaaS Management Platform can help you:
- Find hidden apps: Use AI to scan your entire company for unauthorized apps. Happens in real-time and is constantly running in the background.
- Cut costs: Save money by removing unused licenses and duplicate tools.
- Implement IT automation: Automate your IT tasks to save time and reduce errors - like offboarding and onboarding automation.
- Get contract renewal alerts: Ensure you don’t miss important contract renewals.
Torii is the industry’s first all-in-one SaaS Management Platform, providing a single source of truth across Finance, IT, and Security.
You can learn more about Torii here.
Frequently Asked Questions
To track SaaS license usage, pull active user data from admin APIs or single sign-on logs. Compare this with total licenses purchased to calculate the License Utilization Rate.
The App Redundancy Ratio compares overlapping apps to the total number in each category. A ratio above 0.25 indicates unnecessary complexity and potential cost increases.
To uncover shadow IT, integrate signals from tools like cloud access security brokers. Monitor for unsanctioned app usage and track the trends monthly.
Track department spend, license utilization, app overlap, shadow IT counts, provisioning times, and renewal alerts. These metrics give insights into SaaS costs and inefficiencies.
Identify overlapping apps using the App Redundancy Ratio, then consolidate tools, focusing on strong user satisfaction scores to maintain productivity and usability.
To speed up app provisioning, automate low-risk approvals, bundle access by role, and monitor provisioning times. Establish SLAs to ensure timely access.
Dashboards turn raw SaaS data into actionable insights for decision-makers across finance, IT, and security, facilitating discussions on budget and resource allocation.